
In a world driven by microservices, cloud-native applications, and API-first development, performance testing must evolve. Traditional tools like JMeter or LoadRunner often fall short when it comes to developer-friendliness, cloud scalability, CI/CD integration, and observability. That’s where k6 comes in — an open-source, scriptable load testing tool designed for modern performance engineering. Built with developers and DevOps teams in mind, k6 performance testing allows to shift left, automate easily, and scale in Kubernetes environments.
What is k6?
k6 is a modern load testing tool by Grafana Labs that enables you to write test scripts in JavaScript (ES6). It’s designed to run large-scale load tests with high performance and minimal resource usage.
Key Features:
- Script-based testing using JS
- CLI-based & cloud-compatible
- Built-in thresholds and checks
- Native CI/CD support
- Powerful integrations (Grafana, InfluxDB, Prometheus)
Why Use k6 Over Legacy Tools?
| Feature | k6 | JMeter / LoadRunner |
| Scripting Language | JavaScript (modern) | Java / GUI-based |
| CI/CD Integration | Native | Workarounds / Plugins |
| Distributed Testing | Kubernetes-native support | Limited |
| Performance at Scale | Lightweight Golang engine | Heavy, often resource-hungry |
| Metrics Export | Prometheus, InfluxDB, Grafana | Limited |
How To Run Distributed k6 Tests with Kubernetes
To simulate thousands of virtual users across distributed systems, k6 can be deployed using:
- k6 Operator (official support for Kubernetes)
- xk6-distributed (community-driven scalable framework)
Step-by-step:
1. Install k6-operator:
kubectl apply -f https://raw.githubusercontent.com/grafana/k6-operator/main/bundle.yaml
2. Create a test script configMap:
kubectl create configmap k6-test –from-file=script.js
3. Deploy a k6 test job:
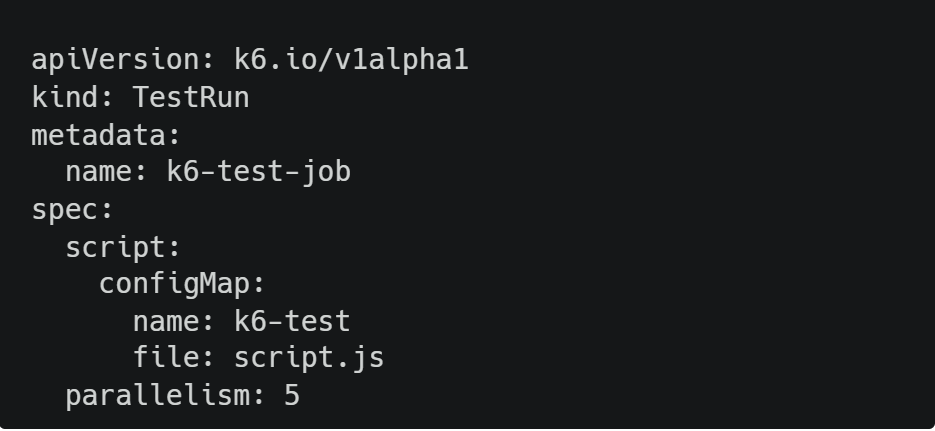
4.Monitor logs and metrics in real-time:
kubectl get pods -l k6-test-run=k6-test-job
kubectl logs -f <pod-name>
CI/CD Integration for Automated Performance Testing
Integrating k6 in CI pipelines (GitHub Actions, GitLab CI, Jenkins) allows you to:
- Automate regression performance tests.
- Gate deployments based on SLA thresholds.
- Track performance trends over time.
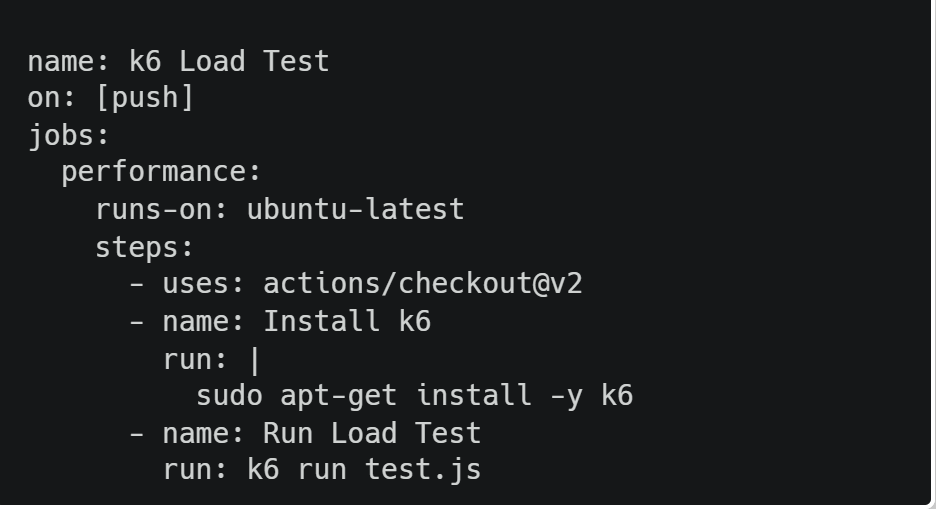
Example: GitHub Actions Workflow
Observability with Grafana, Prometheus & InfluxDB
k6 supports exporting metrics to:
- Prometheus (via remote write gateway)
- InfluxDB
- Datadog
- StatsD
Sample command: k6 run –out influxdb=http://localhost:8086/k6 test.js
Then visualize real-time dashboards in Grafana to track:
- Latency (p95, p99)
- Error rates
- RPS
- Failures per endpoint
Read Also: K6 Performance Testing: What It Is and How to Run Test Scripts
Best Practices for k6 Performance Testing
1. Environment-Driven Configuration for Reusability & Flexibility
Avoid hardcoding URLs, credentials, and test configurations in your scripts. Instead, externalize them using environment variables. This makes your tests environment-agnostic (dev/stage/prod) and CI/CD friendly.
How to do it:
export BASE_URL=https://api.testenv.com k6 run –env BASE_URL=$BASE_URL test.js
const BASE_URL = __ENV.BASE_URL || ‘https://localhost’;
export default function () { http.get(${BASE_URL}/health); }
Why this matters: You can run the same script in different environments without changing code, which supports test versioning and seamless CI/CD integration.
2. Checks and Thresholds: Shift Left with Intelligent Failures
Checks are runtime assertions on the response; thresholds define pass/fail criteria at test level.
Checks example:
check(res, {
‘status is 200’: (r) => r.status === 200,
‘response time < 500ms’: (r) => r.timings.duration < 500
});
Thresholds example:
export let options = { thresholds: { ‘http_req_duration{status:200}’: [‘p(95)<450’], ‘checks’: [‘rate>0.99’], } };
Why this matters: Tests will fail in CI if performance deviates from SLAs, enabling you to catch regressions early.
3. Data Parameterization with JSON/CSV for Realistic Workloads
Static requests don’t simulate real-world usage. Parameterized test data mimics user diversity (logins, searches, transactions).
Example: Using CSV for login data
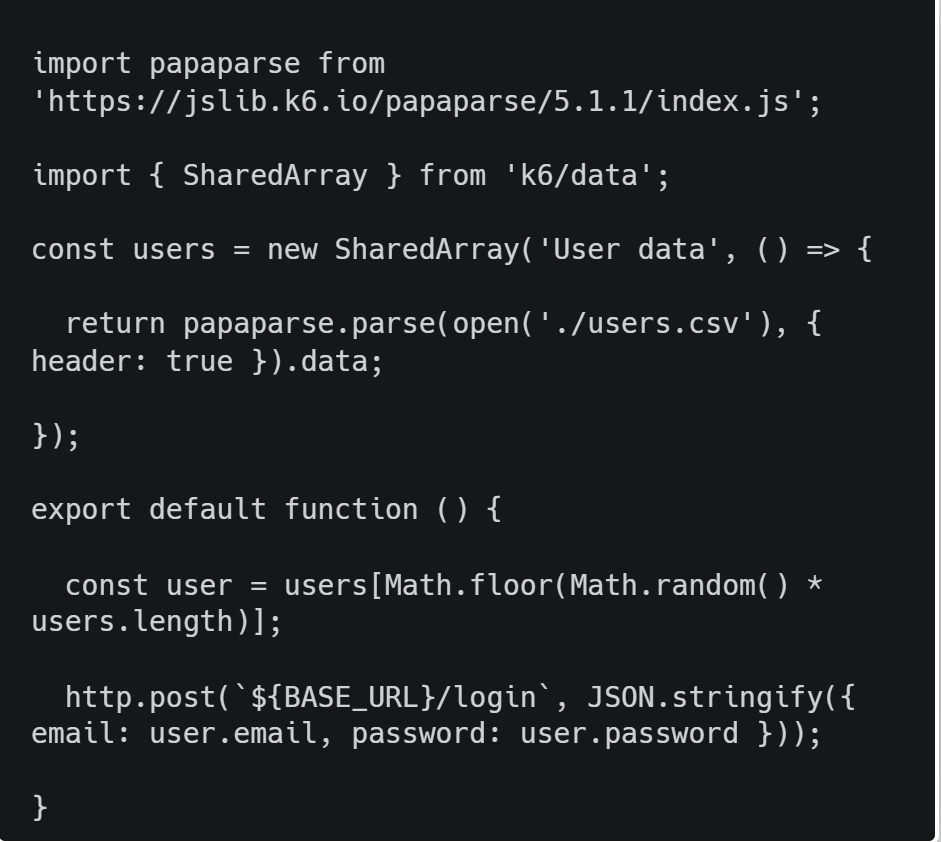
Why this matters: Mimics production behavior by avoiding cache hits and hitting different data paths.
4. Load Patterns: Soak, Spike, Stress, and Baseline Testing
Each test type reveals different performance bottlenecks.
Sample Load Profile:
export let options = {
stages: [
{ duration: ‘2m’, target: 100 }, // Ramp-up
{ duration: ’30m’, target: 100 }, // Soak (stability)
{ duration: ‘2m’, target: 200 }, // Spike (resilience)
{ duration: ‘5m’, target: 0 }, // Cool-down
]
};
Why this matters: Businesses often only load test — but skipping soak or spike testing can lead to unnoticed crashes in production.
5. Distributed Load Testing with k6 Operator or xk6-distributed
For high concurrency testing (e.g., 1 million VUs), you must scale horizontally.
Tools:
- k6 Operator: Deploy k6 natively in Kubernetes.
- xk6-distributed: Experimental framework for distributed load tests.
Example TestRun resource in K8s:
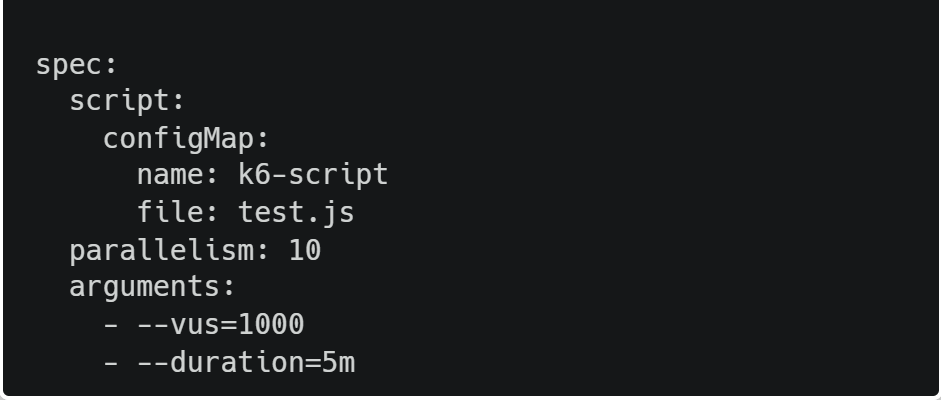
Why this matters: k6 is single-process by design; scaling tests beyond CPU limits requires Kubernetes or distributed runners.
6. Performance Observability with Custom Metrics + Grafana Dashboards
Export test metrics to observability stacks like Prometheus, InfluxDB, or Datadog for real-time performance tracking and alerting.
Exporting to Prometheus:
k6 run –out prometheus-remote=http://localhost:9090/api/v1/write test.js
You can also create custom metrics:
import { Trend } from ‘k6/metrics’;
let loginTime = new Trend(‘login_time’);
export default function () {
let res = http.post(`${BASE_URL}/login`);
loginTime.add(res.timings.duration);
}
Why this matters: Observability turns raw test results into real-time insights — helping QA, DevOps, and SRE teams act faster.
7. Isolate Third-Party Services for Accurate Results
Third-party APIs (e.g., payment gateways, analytics) may introduce noise. Mock them to avoid false performance bottlenecks.
Techniques:
- Use tools like WireMock, MockServer, or TestContainers.
- Setup reverse proxies to redirect traffic.
🔍 Why this matters: You want to test your system’s performance, not get throttled or misled by external dependencies.
Final Thoughts
Modern performance testing needs to be continuous, distributed, and developer-friendly. k6 is the ideal tool for this transformation — enabling teams to test early, often, and at scale.
By combining k6 with Kubernetes and CI/CD, organizations can ensure their applications are resilient under pressure, deliver predictable user experiences, and achieve faster release cycles.
Need Help Scaling Performance Tests?
At Testrig Technologies, we specialize in implementing robust performance testing services using tools like k6, JMeter, Gatling, and Locust — tailored for enterprise-scale applications.
Whether you’re launching a new platform, migrating to the cloud, or preparing for peak traffic, we can help you simulate, analyze, and optimize performance at every level.
Contact us today for a QA consultation or request a free performance audit!